> ## Documentation Index
> Fetch the complete documentation index at: https://docs.m3ter.com/llms.txt
> Use this file to discover all available pages before exploring further.
# Usage Data Explorer (v2)
You can use the *Usage Data Explorer* *(v2)* to configure and perform queries against the metered usage data collected for your Organization in m3ter. It allows you to quickly set up and submit a query that returns the usage data set needed to serve your current analytical purposes:
* **Time Period**. Define a time period for your data query:
* You can select from a set of predefined time period options or define a custom time period.
* The query returns the usage data collected for your Organization for the selected period:
* Note that the query references the *timestamp values* of usage data submissions for applying the defined time period, and *not the time submissions were received* by the platform. Only usage data with a timestamp that falls in the defined time period are returned.
* **Meters**. Select the Meters you want the query to return data for.
* **Accounts**. Select the Accounts you want the query to return data for.
* **Dimension Filters**. Filter the usage data returned by adding specific values of non-numeric Dimension data fields on included Meters. Only the data collected for the values you've added for the selected Dimension fields will be returned for the query.
* **Aggregations**. Apply Aggregation functions to the usage data returned for the query.
* **Grouped by**. For queries that apply Aggregations, you can select to group the data returned for the query by:
* **Account**
* **Time**
* **Dimension**
When you have performed a query, the data is loaded into the Usage Data Explorer (v2) and you can:
* Review the data in a results table and check that it serves your current purposes.
* Download the data in either `CSV` or `JSONL` format.
* Use the query to create a usage Data Export Schedule or to run an Ad-Hoc Data Export.
If you intend to use the Usage Data Explorer (v2) [API endpoints](/api/dataexplorerv2/introduction), for convenience you can view and copy the query JSON.
This topic explains how to work with the Usage Data Explorer (v2) to configure and perform queries against your usage data and review the returned data.
* [Building and Performing Simple Queries](/guides/data-explorer/usage-data-explorer-v2#building-and-performing-simple-queries)
* [Using Dimension Filters for Queries](/guides/data-explorer/usage-data-explorer-v2#using-dimension-filters-for-queries)
* [Applying Aggregations for Queries](/guides/data-explorer/usage-data-explorer-v2#applying-aggregations-for-queries)
* [Managing Result Rows Table Columns](/guides/data-explorer/usage-data-explorer-v2#managing-result-rows-table-columns)
* [Viewing and Copying Queries](/guides/data-explorer/usage-data-explorer-v2#viewing-and-copying-queries)
* [Saving and Re-Using Queries](/guides/data-explorer/usage-data-explorer-v2#saving-and-re-using-queries)
* [Downloading Query Results](/guides/data-explorer/usage-data-explorer-v2#downloading-query-results)
* [Using Queries for Data Export](/guides/data-explorer/usage-data-explorer-v2#using-queries-for-data-export)
**Note: Usage Data Explorers - two versions:**
* **Data Explorer (v2)**. This is the current version and opens when you select **Metering>Usage Data Explorer** in the Console. This topic explains how to open and work with Usage Data Explorer (v2).
* **Legacy Data Explorer**. If you signed up with m3ter after the 1st May 2026, you will not have access to the legacy Data Explorer service, and this version has now passed into maintenance mode with only security fixes being applied henceforth. See [Usage Data Explorer](https://docs.m3ter.com/guides/data-explorer/performing-usage-queries-and-reviewing-results).
## Building and Performing Simple Queries
This section works through an example showing how to build and perform a simple usage data query - a simple query in that it doesn't use any Dimension filters and doesn't apply any Aggregations to the returned data.
**To build and perform a simple query:**
1. Select **Metering>Usage Data Explorer**:
 Usage Data Explorer (v2) opens.
2. Select the **Time period** you want to return usage data for:
* Default is **Today**.
* Other predefined options:
* **Yesterday**.
* **Week**, **Month**, or **Year** to date.
* **Previous week**, **month**, **quarter**, or **year**.
* **Last 12 hours, Last 7**, **30**, **35**, **90**, or **120 days**, or **Last year**.
* If you select a predefined **Time period**, then the start and end date/times are clearly shown in brackets. For example, **Last 120 days**:
Usage Data Explorer (v2) opens.
2. Select the **Time period** you want to return usage data for:
* Default is **Today**.
* Other predefined options:
* **Yesterday**.
* **Week**, **Month**, or **Year** to date.
* **Previous week**, **month**, **quarter**, or **year**.
* **Last 12 hours, Last 7**, **30**, **35**, **90**, or **120 days**, or **Last year**.
* If you select a predefined **Time period**, then the start and end date/times are clearly shown in brackets. For example, **Last 120 days**:
 3. For the current example, select **Custom**. The **Time period** panel adjusts to allow you to enter start and end date/times to define the time period for the query:
 * Note that for a **Custom** period start date/time is *inclusive* and end date/time is *exclusive*. For the current example, we want to include all usage data collected for the entire month of January 2025. We've therefore set the exclusive end date/time as midnight on February 1st 2025. This means the query will return data collected up to the end of day January 31st 2025.
4. Use the plus icon on the **Meters** panel to open a dialog showing a list of Meters in your Organization.
5. On the dialog, check the Meters you want to include data from in your query and select **Add**. The selected Meters are then shown on the **Meters** panel.
* For the current example, we've used the **Search** field on the dialog to filter the list, checked a single Meter, and then added it:
* Note that for a **Custom** period start date/time is *inclusive* and end date/time is *exclusive*. For the current example, we want to include all usage data collected for the entire month of January 2025. We've therefore set the exclusive end date/time as midnight on February 1st 2025. This means the query will return data collected up to the end of day January 31st 2025.
4. Use the plus icon on the **Meters** panel to open a dialog showing a list of Meters in your Organization.
5. On the dialog, check the Meters you want to include data from in your query and select **Add**. The selected Meters are then shown on the **Meters** panel.
* For the current example, we've used the **Search** field on the dialog to filter the list, checked a single Meter, and then added it:
 Note that:
* Alternatively, you can enter the **ID** of a Meter and **Add** it for a query.
* Default is for **All Meters**.
6. Use the plus icon on the **Accounts** panel to open a dialog showing a list of Accounts in your Organization.
7. On the dialog, check the Accounts you want to include data for in your query and select **Add**. The selected Accounts are then shown on the **Accounts** panel.
* For the current example, we've used the **Search** field on the dialog to filter the list, checked a single Account, and then added it:
Note that:
* Alternatively, you can enter the **ID** of a Meter and **Add** it for a query.
* Default is for **All Meters**.
6. Use the plus icon on the **Accounts** panel to open a dialog showing a list of Accounts in your Organization.
7. On the dialog, check the Accounts you want to include data for in your query and select **Add**. The selected Accounts are then shown on the **Accounts** panel.
* For the current example, we've used the **Search** field on the dialog to filter the list, checked a single Account, and then added it:
 Note that:
* Alternatively, you can enter the **ID** of an Account and **Add** it for a query.
* Default is for **All Accounts**.
8. For the current example, we'll not use any **Dimension filters** for the query and we'll omit applying any **Aggregations** for the query results:
Note that:
* Alternatively, you can enter the **ID** of an Account and **Add** it for a query.
* Default is for **All Accounts**.
8. For the current example, we'll not use any **Dimension filters** for the query and we'll omit applying any **Aggregations** for the query results:
 9. Select **Perform query**. The usage data collected for the defined **Time period** by the selected **Meters** and **Accounts** is loaded into a **Result rows** table:
 In this example, we can see:
* Nine usage data submissions have been returned for the selected time period of the entire month of January 2025.
* The selected Meter has four Data Fields configured:
* **File Submits**. A numeric Measure field of type **MEASURE**.
* **GBStore**. A numeric Measure field of type **MEASURE**.
* **Customer Name**. A non-numeric Dimensions field of type **WHO**.
* **Status**. A non-numeric Dimension field of type **METADATA**.
Because no **Dimension filters** were defined and no **Aggregations** were applied, the query has returned all usage data submissions made using the single Meter for the single Account.
In the [next section](/guides/data-explorer/usage-data-explorer-v2#using-dimension-filters-for-queries), we'll use Dimension filters to refine this example query to control the usage data returned.
**Notes and Warnings:**
* **Meter Derived Fields?** If selected Meters contain Derived Fields, then these will also be returned by your query.
* **Result rows limit!** The **Result rows** panel is limited to loading up to **2000** rows. If your query returns more than this limit, the results will not load and you'll be advised to update your query to return fewer rows.
## Using Dimension Filters for Queries
To control the range of usage data a query returns, you can set up Dimension filters for any non-numeric Dimension Data Fields configured for the Meters selected for the query. This section explains how to use Dimension filters and extends the example of a simple query given in the [previous section](/guides/data-explorer/usage-data-explorer-v2#building-and-performing-simple-queries):
* The example used a simple query to return usage data collected by a single Meter and single Account.
* We saw that the example Meter was configured with two numeric or Measure Data Fields and two non-numeric or Dimension Data Fields.
We'll now use the **Customer Name** Dimension field to filter the range of data that's returned by the query.
**To use dimension filters for queries:**
1. Build and perform the simple query example given in the [previous section](/guides/data-explorer/usage-data-explorer-v2#building-and-performing-simple-queries).
2. Before you perform the query, under **Dimension filters** select **Add dimension filter**. A menu appears and lists any Dimension fields for Meters selected for the query:
In this example, we can see:
* Nine usage data submissions have been returned for the selected time period of the entire month of January 2025.
* The selected Meter has four Data Fields configured:
* **File Submits**. A numeric Measure field of type **MEASURE**.
* **GBStore**. A numeric Measure field of type **MEASURE**.
* **Customer Name**. A non-numeric Dimensions field of type **WHO**.
* **Status**. A non-numeric Dimension field of type **METADATA**.
Because no **Dimension filters** were defined and no **Aggregations** were applied, the query has returned all usage data submissions made using the single Meter for the single Account.
In the [next section](/guides/data-explorer/usage-data-explorer-v2#using-dimension-filters-for-queries), we'll use Dimension filters to refine this example query to control the usage data returned.
**Notes and Warnings:**
* **Meter Derived Fields?** If selected Meters contain Derived Fields, then these will also be returned by your query.
* **Result rows limit!** The **Result rows** panel is limited to loading up to **2000** rows. If your query returns more than this limit, the results will not load and you'll be advised to update your query to return fewer rows.
## Using Dimension Filters for Queries
To control the range of usage data a query returns, you can set up Dimension filters for any non-numeric Dimension Data Fields configured for the Meters selected for the query. This section explains how to use Dimension filters and extends the example of a simple query given in the [previous section](/guides/data-explorer/usage-data-explorer-v2#building-and-performing-simple-queries):
* The example used a simple query to return usage data collected by a single Meter and single Account.
* We saw that the example Meter was configured with two numeric or Measure Data Fields and two non-numeric or Dimension Data Fields.
We'll now use the **Customer Name** Dimension field to filter the range of data that's returned by the query.
**To use dimension filters for queries:**
1. Build and perform the simple query example given in the [previous section](/guides/data-explorer/usage-data-explorer-v2#building-and-performing-simple-queries).
2. Before you perform the query, under **Dimension filters** select **Add dimension filter**. A menu appears and lists any Dimension fields for Meters selected for the query:
 * In the current example, a single Meter has two Dimension fields configured.
3. Select the Meter Dimension field you want to use to filter the data returned for the query. For the current example, we'll select **RevGraph Meter 1 > Customer Name**. A dialog replaces the menu, which lists values used for this field when usage submissions were made for the Meter within the selected **Time period**.
4. Check the values used for the selected Meter Dimension field you want to use to filter the data returned for the query and then select **Add filter**:
* In the current example, a single Meter has two Dimension fields configured.
3. Select the Meter Dimension field you want to use to filter the data returned for the query. For the current example, we'll select **RevGraph Meter 1 > Customer Name**. A dialog replaces the menu, which lists values used for this field when usage submissions were made for the Meter within the selected **Time period**.
4. Check the values used for the selected Meter Dimension field you want to use to filter the data returned for the query and then select **Add filter**:
 The dialog closes and the select Dimension field values are added under **Dimension filters**:
 5. Select **Perform query**. The filtered query executes and returns the data into the **Result rows** panel:
 * For the current example, we can see that the data returned for the filtered query now includes only those usage submissions made for **Customer Pay1** values for the **Customer Name** Dimension field on the Meter.
## Applying Aggregations for Queries
When building a query in the Usage Data Explorer (v2), you can choose to apply Aggregations to the usage data collected by any Data Fields on the Meters selected for the query.
This section explains the options you have when using Aggregations for queries and the consequences of using Aggregations. It then explains how to create and perform aggregated queries with some typical examples:
* [Aggregations for Queries - Understanding Options and Consequences](/guides/data-explorer/usage-data-explorer-v2#aggregations-for-queries---understanding-options-and-consequences)
* [Applying Aggregations to Queries and Grouping Results](/guides/data-explorer/usage-data-explorer-v2#applying-aggregations-to-queries-and-grouping-results)
### Aggregations for Queries - Understanding Options and Consequences
Before you attempt to use Aggregations for your queries in the Usage Data Explorer (v2), it's important to understand the options you have and the consequences that aggregating the data returned by the query will have.
There are two types of Meter Data Fields:
* **Measures**. Numeric fields of category **MEASURE**, **INCOME**, or **COST**.
* **Dimensions**. Non-numeric fields of category **WHO**, **WHAT**, **WHERE**, **METADATA**, or **OTHER**.
When building queries in Usage Data Explorer (v2), the available Aggregation methods for the various Meter Data Field categories are as follows:
| Aggregation Method | What it does | Can be applied to Meter field categories |
| ------------------ | ---------------------------------------------------------------------------------------- | ----------------------------------------------------------- |
| Sum | Adds the values. | MEASURE, INCOME, or COST |
| Minimum | Uses the minimum value. | MEASURE, INCOME, or COST |
| Maximum | Used the maximum value. | MEASURE, INCOME, or COST |
| Count | Counts the number of values. | MEASURE, INCOME, COST, WHO, WHAT, WHERE, METADATA, or OTHER |
| Latest | Uses the most recent value. Based on the timestamp (ts) value of usage data submissions. | MEASURE, INCOME, or COST |
| Mean | Uses the arithmetic mean of the values. | MEASURE, INCOME, or COST |
| Unique | Uses unique values and returns a count of the number of unique values. | WHO, WHAT, WHERE, METADATA, or OTHER |
If you apply Aggregations for a query:
* This restricts the range of usage data returned by the query to only the data collected by the aggregated fields on Meters. Nothing is returned for any non-aggregated fields on Meters.
* The usage data for Meter fields is returned as the values resulting from applying the selected aggregation method.
* You can then select to group the results of the aggregated data returned by:
* **Account**
* **Time**
* **Dimension**
### Applying Aggregations to Queries and Grouping Results
This section provides some examples of aggregated queries with grouped results:
* **Example 1**. [Results grouped by Dimension](/guides/data-explorer/usage-data-explorer-v2#aggregated-queries-with-grouped-results-example-1)
* **Example 2**. [Results grouped by Time](/guides/data-explorer/usage-data-explorer-v2#aggregated-queries-with-grouped-results-example-2)
* **Example 3**. [Results grouped by Account](/guides/data-explorer/usage-data-explorer-v2#aggregated-queries-with-grouped-results-example-3)
#### Aggregated Queries with Grouped Results - Example 1
This example extends the simple unfiltered query example from the earlier section to show how to apply aggregations to usage data returned for the query. It then goes on to show how to group the query results by a Dimension.
**To apply aggregations for queries and group the results:**
1. Build and perform the simple unfiltered query example given in the [earlier section](/guides/data-explorer/usage-data-explorer-v2#building-and-performing-simple-queries).
2. Under **Aggregations**, select **Add aggregation**. A menu listing available aggregation methods appears:
* For the current example, we can see that the data returned for the filtered query now includes only those usage submissions made for **Customer Pay1** values for the **Customer Name** Dimension field on the Meter.
## Applying Aggregations for Queries
When building a query in the Usage Data Explorer (v2), you can choose to apply Aggregations to the usage data collected by any Data Fields on the Meters selected for the query.
This section explains the options you have when using Aggregations for queries and the consequences of using Aggregations. It then explains how to create and perform aggregated queries with some typical examples:
* [Aggregations for Queries - Understanding Options and Consequences](/guides/data-explorer/usage-data-explorer-v2#aggregations-for-queries---understanding-options-and-consequences)
* [Applying Aggregations to Queries and Grouping Results](/guides/data-explorer/usage-data-explorer-v2#applying-aggregations-to-queries-and-grouping-results)
### Aggregations for Queries - Understanding Options and Consequences
Before you attempt to use Aggregations for your queries in the Usage Data Explorer (v2), it's important to understand the options you have and the consequences that aggregating the data returned by the query will have.
There are two types of Meter Data Fields:
* **Measures**. Numeric fields of category **MEASURE**, **INCOME**, or **COST**.
* **Dimensions**. Non-numeric fields of category **WHO**, **WHAT**, **WHERE**, **METADATA**, or **OTHER**.
When building queries in Usage Data Explorer (v2), the available Aggregation methods for the various Meter Data Field categories are as follows:
| Aggregation Method | What it does | Can be applied to Meter field categories |
| ------------------ | ---------------------------------------------------------------------------------------- | ----------------------------------------------------------- |
| Sum | Adds the values. | MEASURE, INCOME, or COST |
| Minimum | Uses the minimum value. | MEASURE, INCOME, or COST |
| Maximum | Used the maximum value. | MEASURE, INCOME, or COST |
| Count | Counts the number of values. | MEASURE, INCOME, COST, WHO, WHAT, WHERE, METADATA, or OTHER |
| Latest | Uses the most recent value. Based on the timestamp (ts) value of usage data submissions. | MEASURE, INCOME, or COST |
| Mean | Uses the arithmetic mean of the values. | MEASURE, INCOME, or COST |
| Unique | Uses unique values and returns a count of the number of unique values. | WHO, WHAT, WHERE, METADATA, or OTHER |
If you apply Aggregations for a query:
* This restricts the range of usage data returned by the query to only the data collected by the aggregated fields on Meters. Nothing is returned for any non-aggregated fields on Meters.
* The usage data for Meter fields is returned as the values resulting from applying the selected aggregation method.
* You can then select to group the results of the aggregated data returned by:
* **Account**
* **Time**
* **Dimension**
### Applying Aggregations to Queries and Grouping Results
This section provides some examples of aggregated queries with grouped results:
* **Example 1**. [Results grouped by Dimension](/guides/data-explorer/usage-data-explorer-v2#aggregated-queries-with-grouped-results-example-1)
* **Example 2**. [Results grouped by Time](/guides/data-explorer/usage-data-explorer-v2#aggregated-queries-with-grouped-results-example-2)
* **Example 3**. [Results grouped by Account](/guides/data-explorer/usage-data-explorer-v2#aggregated-queries-with-grouped-results-example-3)
#### Aggregated Queries with Grouped Results - Example 1
This example extends the simple unfiltered query example from the earlier section to show how to apply aggregations to usage data returned for the query. It then goes on to show how to group the query results by a Dimension.
**To apply aggregations for queries and group the results:**
1. Build and perform the simple unfiltered query example given in the [earlier section](/guides/data-explorer/usage-data-explorer-v2#building-and-performing-simple-queries).
2. Under **Aggregations**, select **Add aggregation**. A menu listing available aggregation methods appears:
 3. For the current example, select **Sum**. A dialog replaces the menu and shows the fields on the Meters selected for the query which can have this aggregation method applied:
 In the current example, the two Meter fields of category **MEASURE** - **File Submits** and **GBStore** are listed.
4. Select to **Sum** the **RevGraph Meter 1 > GB Store** numeric data field. The dialog closes and the aggregation is added.
5. Repeat steps 2 to 4 to apply a **Sum** aggregation to the **File Submits** Meter field:
In the current example, the two Meter fields of category **MEASURE** - **File Submits** and **GBStore** are listed.
4. Select to **Sum** the **RevGraph Meter 1 > GB Store** numeric data field. The dialog closes and the aggregation is added.
5. Repeat steps 2 to 4 to apply a **Sum** aggregation to the **File Submits** Meter field:
 6. Select **Perform Query**. The query with aggregations applied executes and returns the data into the **Result rows** panel:
 Suppose now we want to see how many different customers were responsible for these totals of file submissions and Gigabytes stored.
7. Repeat steps 2 to 4 to apply a **Unique** aggregation to the **Customer Name** Meter field:
Suppose now we want to see how many different customers were responsible for these totals of file submissions and Gigabytes stored.
7. Repeat steps 2 to 4 to apply a **Unique** aggregation to the **Customer Name** Meter field:
 8. Select **Perform Query**. The query executes and returns the data into the **Result rows** panel:
 We can see that only two distinct customers were responsible for the totals of usage data.
Suppose now that we want to check how the totals were distributed between the two customers. We can use the **grouped by** option to do this.
9. First, remove the **Unique** aggregation of the **Customer Name** Dimension field from the query.
10. Under **Aggregations**, select the **grouped by** plus icon. A menu appears:
We can see that only two distinct customers were responsible for the totals of usage data.
Suppose now that we want to check how the totals were distributed between the two customers. We can use the **grouped by** option to do this.
9. First, remove the **Unique** aggregation of the **Customer Name** Dimension field from the query.
10. Under **Aggregations**, select the **grouped by** plus icon. A menu appears:
 11. Select **Dimension**. The menu is replaced with a **Dimension** dialog:
 12. Select the **Dimension** you want to group the aggregated usage by. For the current example, **RevGraph Meter 1 > Customer Name**.
13. Select **Perform Query**. The query executes and returns the data into the **Result rows** panel:
12. Select the **Dimension** you want to group the aggregated usage by. For the current example, **RevGraph Meter 1 > Customer Name**.
13. Select **Perform Query**. The query executes and returns the data into the **Result rows** panel:
 #### Aggregated Queries with Grouped Results - Example 2
This example uses a query that aggregates measures data by a SUM method over a month and then groups the results by day.
**To apply aggregations for queries and group the results:**
1. Build and perform an unfiltered query with **Sum** aggregations applied to MEASURE Data Fields on selected Meters:
#### Aggregated Queries with Grouped Results - Example 2
This example uses a query that aggregates measures data by a SUM method over a month and then groups the results by day.
**To apply aggregations for queries and group the results:**
1. Build and perform an unfiltered query with **Sum** aggregations applied to MEASURE Data Fields on selected Meters:
 * The query returns the data for the month of February 2025 collected for a single Meter and Account, and aggregates for a Sum of the data for each of the MEASURE fields on the Meter.
* The data is returned into the **Result rows** table as a single row.
Suppose we want to review the sum of usage data over the month by day. We can do this using the **grouped by** option by **Time**.
2. Under **Aggregations**, select the **grouped by** plus icon. A menu appears:
* The query returns the data for the month of February 2025 collected for a single Meter and Account, and aggregates for a Sum of the data for each of the MEASURE fields on the Meter.
* The data is returned into the **Result rows** table as a single row.
Suppose we want to review the sum of usage data over the month by day. We can do this using the **grouped by** option by **Time**.
2. Under **Aggregations**, select the **grouped by** plus icon. A menu appears:
 3. Select **Time**. The menu is replaced with a **Time** dialog:
 4. Select **Daily**.
5. Select **Perform Query**. The query executes and returns the data into the **Result rows** panel:
4. Select **Daily**.
5. Select **Perform Query**. The query executes and returns the data into the **Result rows** panel:
 #### Aggregated Queries with Grouped Results - Example 3
This example uses a query that aggregates measures data by a SUM method over a month and then groups the results by Account.
**To apply aggregations for queries and group the results:**
1. Build and perform an unfiltered query with Sum aggregations applied to MEASURE Data Fields on selected Meters:
#### Aggregated Queries with Grouped Results - Example 3
This example uses a query that aggregates measures data by a SUM method over a month and then groups the results by Account.
**To apply aggregations for queries and group the results:**
1. Build and perform an unfiltered query with Sum aggregations applied to MEASURE Data Fields on selected Meters:
 * The query returns the data for the month of January 2025 collected for a single Meter and all Accounts, and aggregates for a Sum of the data for each of the MEASURE fields on the Meter.
* The data is returned into the **Result rows** table as a single row.
Suppose we want to review the sum of usage data over the month by Account. We can do this using the **grouped by** option by **Account**.
2. Under **Aggregations**, select the **grouped by** plus icon. A menu appears:
* The query returns the data for the month of January 2025 collected for a single Meter and all Accounts, and aggregates for a Sum of the data for each of the MEASURE fields on the Meter.
* The data is returned into the **Result rows** table as a single row.
Suppose we want to review the sum of usage data over the month by Account. We can do this using the **grouped by** option by **Account**.
2. Under **Aggregations**, select the **grouped by** plus icon. A menu appears:
 3. Select **Account**.
4. Select **Perform Query**. The query executes and returns the data into the **Result rows** panel:
3. Select **Account**.
4. Select **Perform Query**. The query executes and returns the data into the **Result rows** panel:
 ## Managing Result Rows Table Columns
When you perform a query the usage data returned for the query is loaded into the **Result rows** table. You can then open a *Columns* dialog to show or hide some table columns.
**To manage Result rows table columns:**
1. Build and perform the query that returns the usage data results required for your analytical purposes. For example:
## Managing Result Rows Table Columns
When you perform a query the usage data returned for the query is loaded into the **Result rows** table. You can then open a *Columns* dialog to show or hide some table columns.
**To manage Result rows table columns:**
1. Build and perform the query that returns the usage data results required for your analytical purposes. For example:
 2. At the right-side of the **Result rows** table, select **Columns**. A menu appears:
 * The columns in the **Result rows** table will depend upon the query you've performed and some columns will be shown by default - such as the **Timestamp**, **Meter**, and **Account** columns in this example - and you will not be able to hide some - such as the Meter field data columns in this example:
 3. You can hide and show columns to suit current requirements. For the current example, you might want to hide the **Timestamp** column and show the usage data measurement **UID** instead:
 * The **Result rows** table adjusts accordingly:
 4. When you've finished showing or hiding columns for the **Result rows** table, select **Columns** again to close the menu.
## Viewing and Copying Queries
As you are building a query, you might want to review the query's JSON structure. This can be helpful if you intend to use the Usage Data Explorer (v2) [API query endpoint](/api/dataexplorerv2/query-and-filter-usage-data). For convenience, you can quickly view a query's JSON and copy it from the explorer page in the Console.
**To view and copy queries:**
1. Build and perform the query that returns the usage data results required for your analytical purposes.
2. In the Usage Data Explorer (v2), select **View query**:
4. When you've finished showing or hiding columns for the **Result rows** table, select **Columns** again to close the menu.
## Viewing and Copying Queries
As you are building a query, you might want to review the query's JSON structure. This can be helpful if you intend to use the Usage Data Explorer (v2) [API query endpoint](/api/dataexplorerv2/query-and-filter-usage-data). For convenience, you can quickly view a query's JSON and copy it from the explorer page in the Console.
**To view and copy queries:**
1. Build and perform the query that returns the usage data results required for your analytical purposes.
2. In the Usage Data Explorer (v2), select **View query**:
 A modal appears containing the query JSON as currently configured:
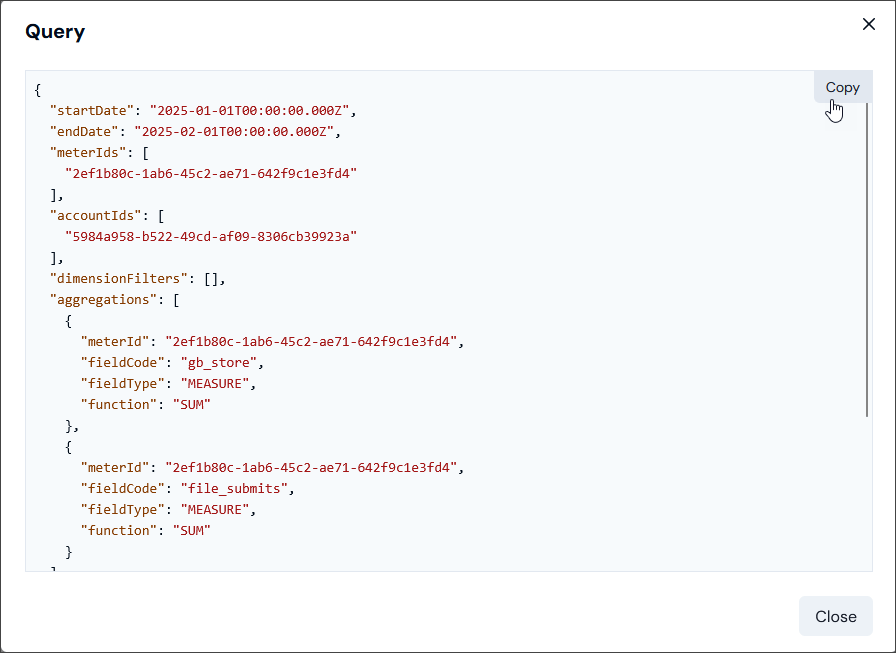 3. You can **Copy** the query JSON to your clipboard, if required.
**Tip: API for Usage Data Explorer (v2)?** See the [DataExplorerV2](/api/dataexplorerv2/introduction) section of our API Reference for details.
## Saving and Re-Using Queries
You can save queries and re-use them.
**To save and re-use queries:**
1. In the **Query** panel, build and perform the query that returns the usage data results required for your analytical purposes.
2. Select **Save query**:
3. You can **Copy** the query JSON to your clipboard, if required.
**Tip: API for Usage Data Explorer (v2)?** See the [DataExplorerV2](/api/dataexplorerv2/introduction) section of our API Reference for details.
## Saving and Re-Using Queries
You can save queries and re-use them.
**To save and re-use queries:**
1. In the **Query** panel, build and perform the query that returns the usage data results required for your analytical purposes.
2. Select **Save query**:
 A **Save query** dialog appears.
3. Enter a **Query name** and select **Save query**:
A **Save query** dialog appears.
3. Enter a **Query name** and select **Save query**:
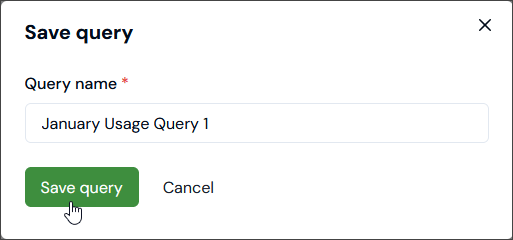 The **Save query** dialog closes and a **Query successfully saved** message appears.
4. If you want to re-use a saved query, on the **Query** panel select **Saved queries**:
The **Save query** dialog closes and a **Query successfully saved** message appears.
4. If you want to re-use a saved query, on the **Query** panel select **Saved queries**:
 A **Saved queries** dialog appears.
5. For the saved query you want to re-use, select **Load query**:
A **Saved queries** dialog appears.
5. For the saved query you want to re-use, select **Load query**:
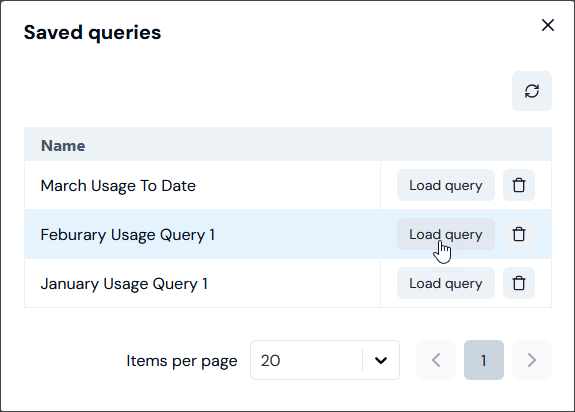 The dialog closes and the selected saved query is loaded onto the **Query** panel.
* Note that you can *delete saved queries* on the **Saved queries** dialog.
6. Make adjustments to the loaded query, if required, and select **Perform query**. The query executes and returns the data into the **Result rows** panel.
## Downloading Query Results
When you have built a usage data query in Usage Data Explorer (v2), you can export the results returned for the query as a `CSV` or `JSONL` formatted file.
**To download query results:**
1. Build and perform the query that returns the usage data results required for your analytical purposes and which you want to download for use elsewhere.
2. On the **Result rows** panel, select **Download CSV** or **Download JSONL**. The returned data set that was loaded into the **Result rows** panel from the query is compiled in a *.csv* or *.jsonl* formatted file, downloaded, and saved locally.
## Using Queries for Data Export
When you've set up and performed a query in Usage Data Explorer (v2), you can quickly use the query for creating usage Data Export Schedules or to run an Ad-Hoc Data Export.
**To use queries for Data Exports:**
1. Build and perform the query that returns the usage data results you want to export using the Data Export service.
2. If you want to use the query to create a Usage Data Export Schedule, select **Create export schedule**:
The dialog closes and the selected saved query is loaded onto the **Query** panel.
* Note that you can *delete saved queries* on the **Saved queries** dialog.
6. Make adjustments to the loaded query, if required, and select **Perform query**. The query executes and returns the data into the **Result rows** panel.
## Downloading Query Results
When you have built a usage data query in Usage Data Explorer (v2), you can export the results returned for the query as a `CSV` or `JSONL` formatted file.
**To download query results:**
1. Build and perform the query that returns the usage data results required for your analytical purposes and which you want to download for use elsewhere.
2. On the **Result rows** panel, select **Download CSV** or **Download JSONL**. The returned data set that was loaded into the **Result rows** panel from the query is compiled in a *.csv* or *.jsonl* formatted file, downloaded, and saved locally.
## Using Queries for Data Export
When you've set up and performed a query in Usage Data Explorer (v2), you can quickly use the query for creating usage Data Export Schedules or to run an Ad-Hoc Data Export.
**To use queries for Data Exports:**
1. Build and perform the query that returns the usage data results you want to export using the Data Export service.
2. If you want to use the query to create a Usage Data Export Schedule, select **Create export schedule**:
 The **Export schedules>Create** page opens with the query loaded for the **Export schedule details**. You can now proceed to configure the Data Export Schedule. See [Creating Usage Data Export Schedules](/guides/data-exports/creating-export-schedules) for more details.
**Note: Using Custom Time Period?** If you've set up a usage data query in Data Explorer that uses a **Custom** time period, when you load the query for configuring an Export Schedule, this *static time period* is not available for Export Schedules and the default of **Today** is used instead.
3. If you want to use the query to run and Ad-Hoc Usage Data Export, select **Run ad-hoc export**:
The **Export schedules>Create** page opens with the query loaded for the **Export schedule details**. You can now proceed to configure the Data Export Schedule. See [Creating Usage Data Export Schedules](/guides/data-exports/creating-export-schedules) for more details.
**Note: Using Custom Time Period?** If you've set up a usage data query in Data Explorer that uses a **Custom** time period, when you load the query for configuring an Export Schedule, this *static time period* is not available for Export Schedules and the default of **Today** is used instead.
3. If you want to use the query to run and Ad-Hoc Usage Data Export, select **Run ad-hoc export**:
 The **Run ad-hoc export** page opens with the query loaded for the **Ad-hoc export details**. You can now proceed to configure the Ad-Hoc Usage Data Export. See [Running Ad-Hoc Usage Data Exports](/guides/data-exports/running-ad-hoc-data-exports) for more details.