The m3ter Console is designed to facilitate setting up and configuring your Organization to implement usage-based and unit-based pricing for the products and services you offer to your customers. The following video offers a quick walk through orientation of the m3ter Console:Review this topic for guidance and pointers on the layout and features you’ll find in the Console and to help familiarize yourself with the m3ter Console before you move on to setting up and managing your m3ter Organization:
When you first log in to the m3ter Console, the Dashboard opens:From the Dashboard, you can:
Use the Recent Accounts panel to track Accounts you’ve worked with in your recent sessions in the Console - as you start to create and configure Accounts for your Organization, these will be added. The most recently visited Account appears at the top of the list, and you can select the NAME hotlink text to re-open the details page of an Account.
Review Your Alerts for your Organization. Select View All to open the main Alerts page. For more details, see Viewing and Managing Alerts.
The m3ter Console is broken down into sections designed to support and optimize your configuration and operational workflows when setting up and managing your Organization for metered pricing and billing. You can open sections from the top navigation - for example the Metering section:Use the Expand icon at bottom-left:This opens a section’s Nav panel for the pages available in the section:Use the Collapse icon if required to hide the section Nav panel:
Create Meters, Aggregations, and Compound Aggregations to collect usage data and aggregate that usage data into specific usage measurements to use as pricing metrics to apply usage-based pricing to your Product Plans.
Create Counters to use as pricing metrics to apply unit-based pricing to your Product Plans. Use Counters to define unit quantities on end-customer Accounts.
Review Ingest Events to check for validation errors logged for usage data measurement submissions.
Open a Usage Data Explorer to query for ingested usage data and review and check query results.
Create and Manage automation and interoperability features for your Organization:
Workflows. Create automation routines to:
Control the exchange of data between your m3ter Organization and your external systems.
Fulfill key business operational use case for billing and accounts management within your m3ter production environment.
Notification rules. Set up rules to define when Notifications are triggered with reference to an Event.
Credentials. Create, view, and manage the Credentials for your Organization and required for:
Authentication with external systems for your Integrations.
Authentication with the designated webhook endpoint to support Notification webhook integrations.
Authentication for various types of Workflow function: API functions that call an external system use Credentials set up for that system; API functions that call the m3ter system use m3ter Service User Credentials.
Workflows using an Incoming Webhook as trigger require Incoming Webhook Credentials to authenticate with the Workflow as destination.
Integrations. Create and manage integrations for your m3ter Organization with 3rd-party systems.
Outgoing webhooks. If you’ve defined a Notification rule based on a system Event, you can link this to an Outgoing webhook as the endpoint for the Notification.
Integration events. Review and follow up on integrations error Events to troubleshoot and resolve them.
External mappings. Create and manage External mappings to act as mapping reference lookups for which entities and fields have been mapped across two or more systems.
Transformations. Transformations define one-way data mappings from one specific data type to another. When building Workflows, you can use functions that reference Transformations.
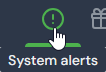
Review and manage System Alerts, which are automatically generated for your m3ter Organization, informing you about key events and notifying you of any issues or errors.
The m3ter Data Export service allows you to export usage data and operational data from your m3ter Organization directly into your AWS S3 or Google Cloud Storage buckets.
Please note that the Data Export feature is currently available only in Preview release version. If not yet enabled for your Organization, this menu option will be grayed out. If you’re interested in previewing the Data Export feature, please get in touch with m3ter Support or your m3ter contact.
Select Documentation to search our comprehensive User and API Reference documentation. Enter a Search term and then select to open a specific page from the returned search results:
Documentation AI. Select Ask AI. An AI Assistant panel opens at the right-hand side and you can enter a question, for example:
When possible, the AI Assistant provides an answer together with links to any relevant available documentation topics for further details.
Open a page to check the operational status of the m3ter platform’s Config and Ingest API services. See below: Checking Service Status for more details.
Open a Product Portal page where you can review our roadmap of new features and capabilities planned for the m3ter Platform. You can also submit any ideas or suggestions for new features directly to us from here.
Also available as you work in the Console are Info links which open the Help panel giving immediate context relative guidance on pages and features.For example, if you select Info on the Meters page:The Help panel opens and gives a short explanation of what the page lets you do with links to relevant documentation for further guidance:Info links are also available for help on individual fields, for example when setting up a Notification rule:Again, the Help panel opens with brief guidance on how to use the setting with links out to the relevant further guidance in our documentation:
On the Details pages for the main entities in your m3ter Organization - such as the Account Details pages - you can quickly review an entity’s metadata.Custom Fields. Any Custom Fields created for the entity are listed, and you can Copy the String or Number value of a Custom Field to your clipboard.
If the fields have been created only at Organizational-level, then these values will be shown:
If the fields have also been created for an individual entity, then the values configured for those created at Organizational-level are struck out indicating clearly that the Account level values will be used:
External Mappings. Any External Mappings for the entity are listed:
The External system, External table, and External entity ID mapped to are shown.
If a listed External mapping is linked to an Integration, under Linked integration a hotlink text will be shown which you can use to open the Integration.
Under Actions, you can edit or delete the External mapping.
If the entity has multiple External mappings created for it, you can use Search external mappings to search by External table and External entity ID and filter the list.
Integration runs. If you’ve set up an integration that synchronizes the entity with an external system, the date/time and status of the Latest integration run are shown. You can use a text hotlink to open details of this latest run or View all runs. See Reviewing Integration Run Details.
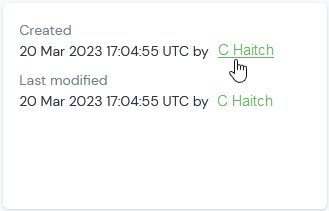
As you and your colleagues start to work with your m3ter Organization, you’ll find that many of the Details pages for the main configuration entities created for your Organization - such as the Meter Details pages - carry audit information on which User:
Initially created the entity.
Most recently modified the entity.
This audit data also allows you to click a hotlink text to open the details page for the logged User:
Tip: User Activity is also shown on Account Specific Details Pages! Which User created and which User last modified is also tracked in the Console on the details pages for some Account specific entities - Account Plans, Prepayments, Balances, and Contracts on an Account.
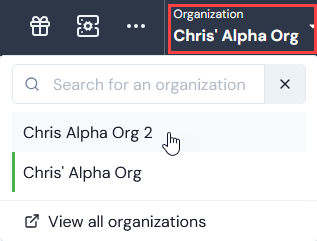
Many m3ter Users have access to more than one Organization. You can quickly switch to another Organization to which you have access using the Organization box at top-right. This shows the current Organization you are working in - select the arrow to show a list of all Organizations you have access to and then select the one you want to switch to:
If you have access to multiple Organizations, you can use the Search field to filter the list.
If you select View all organizations, you are taken back to the Select Organization page that opens when you first log into the Console. The LAST ACCESSED Organization is shown and you can search for and select to open any of the other Organizations you have access to.
To check the operational status of the m3ter platform’s Config, Ingest, and Search API services, select the Help>Service Status link:A m3ter Service Status page opens in a separate tab:On this page you can read-off the current operational status of the platform’s Config API, Ingest API, and Search API services, together with a percentage measure of uptime over the last 90 days.If you scroll down the page, you can check for any incidents reported over the past 15 days:If you scroll to the bottom of the page, you can check Incident History:This opens an Incidents tab for the previous 3 months:You can page backwards and forwards to show specific 3-month periods:Select the Uptime tab to review the historical daily uptime for each API service for the selected 3-month period:If you want to receive notifications when an incident with the service is created, updated, or resolved, select SUBSCRIBE TO UPDATES. You can then select and set up your preferred method of receiving updates:
Email. Enter your Email address and select SUBSCRIBE VIA EMAIL:
Text message. Select your Country code and enter your Phone number and select SUBSCRIBE VIA TEXT MESSAGE:
Slack. Select SUBSCRIBE VIA SLACK:
Microsoft Teams channel. Enter Channel’s Webhook URL and select SUBSCRIBE VIA TEAMS:
Atom Feed or RSS Feed. Etc:
If you’re still experiencing problems after a recovery has been posted on the status page, then please contact m3ter Support.